Inequality is quite the hot topic these days, and one of the best ways to measure it is the Gini Index. The Gini index was created by Corrado Gini in 1912.
The Gini Index spans from 0 to 1, and provides a numerical value describing how equally income is distributed within a certain group. A society in which all the wealth belonged to one person would have a score of 1, whereas a society in which each person has an equal amount of money has a score of 0.
The Gini Index is best explained graphically.
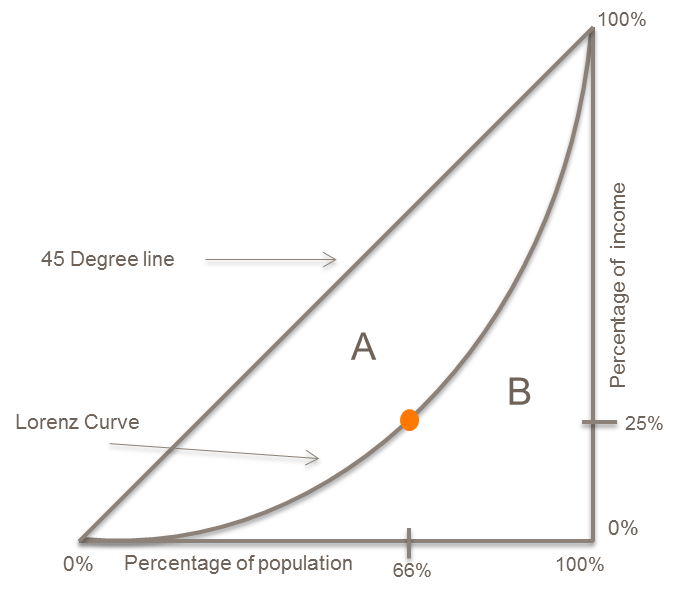
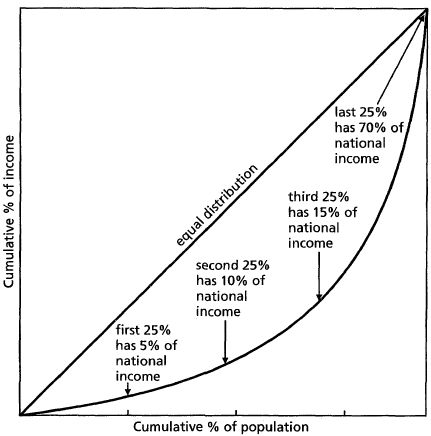
The 45 Degree Line represents perfect equality, which would be a Gini Index of 0. Each member of the population has a proportional share of the income, so it is a perfect line. The Lorenz Curve represents the actual distribution of income. For example, take the orange point on the Lorenz Curve. This curve tells us the distribution of income, indicating that 2/3 the population holds ¼ the income. The graph below provides a good further representation of how the Lorenz Curve shows distribution of income.
The Gini index is derived by dividing area A/(A+B). This number shows us the difference between a perfectly equal distribution of income (45 degree line) and the actual distribution of income.
If all the income was equally distributed, the Gini coefficient is 0 because area A would not exist (Lorenz curve in this case would be the same line as the 45 degree line), making A = 0, and thus 0/(0+B) = 0.
So where does the US lie in the range of global Gini indexes?
The US currently clocks in with a Gini index of .47. Countries with the highest Gini indexes typically lie in the .6-.7 range, and are mostly African countries. The lowest Gini indexes in the world lie in the .2-.3 range, and stem (unsurprisingly) from Scandinavian countries. You can find information on Gini indexes for countries around the world here, although some of them are out of date.
Most importantly, the Gini coefficient (A/A+B) is not limited to simply income inequality. The Gini coefficient and framework provides a powerful statistical tool that can be applied to virtually any field seeking to measure how the population fits within a certain criteria.


Money represents a social agreement, which has implications for how we value wealthy people. Bitcoin replaces the need for this social agreement with technology, and in doing so challenges the values we ascribe to wealth.